Thats a failed heartbeat of the consensus algorithm underneath. Might be nothing. Might be a problem with network latency and/or reliability. The RAFT concensus requires a low latency, low jitter network for proper operation.
Thanks for the response. We currently have a docker swarm with 12 stacks deployed, and on several occasions (at different times) we noticed that the stack (and all the containers were shutdown and rebuilt) causing service disruptions but we don’t know why
The only reference we have is to look through the syslog entries but we can’t find a definitive answer. We have increased the heartbeat from 5s to 20s (30s) and now 1m in order to prevent the stack to shutdown the containers
We have seen a spike in CPU usage when the stack is rebuilt but we don’t know what is the cause
Network bandwitdh, memory
We deployed docker swarm onto 1 server and had no issues for well over a year, and now we experience this issue every two days. (it seems)
So your solution to missing heartbeats is to make them appear less frequently? Brilliant!
Hearbeat concerns custer membership, though it does not influence the timeframe which is required to reach consensus amongst the manager nodes for changes. Though, since you seem to have only one node. This shouldn’t be the problem.
Ah, with rebuild you mean redeploy. Though, the stack itself shoudn’t be redeployed. If the number of tasks of a service matches the number of desired replicas, there shouldn’t be any redployment. Depending on your restart policy, the death of a container created by a task won’t do anything or deploy a new task to statisfy the number of desired replicas. Are you sure your containers are not oom killed (see: dmesg)? Of course deployments put stress on the ressource - do you expect that they don’t? Bootstrapping applications usualy is not a cheap task…
If you have a single server, consensus can’t be the problem. Neither can be the network.
I agree with your assessment, we are trying to figure out why on a server with little stress all of a sudden all the docker managers has to rebuild all of the containers at the same time, the application logs don’t show spikes in memory or cpu. We will begin taking a closer look at the dmesg, for hints or oom issues.
Is it one manager or more than one?! I feel like you do not share all details.
I pretty much loose interesst if the level of details is insufficient to get a fair chance to think thru the situation. Some brilliant minds try to run a swarm cluster with nodes at different locations - which would pretty much explain the situation. Others simply overprovision their cluster nodes, because they didn’t understand why it’s imperative to set resources reservervations and limits for cpus an memory.
before you ask again. this literally is the dmesg command.
Good luck with your troubleshooting. I will leave this one to others. I am not stasified with the level of provided details.
In any case we are moving to turn debug mode on and see if can narrow down the issue further. Unfortunately the dmesg entries do not show a driver error at the same time our docker daemon rebuilt the entire stack of applications.
May I suggest to install Prometheus, Grafana and a decent log management like Loki or ELK to your environment. What about the output from the command dmesg?
Running containers in a professional setting does not make sense without proper system monitoring and log management.
[Wed Sep 23 03:07:35 2020] IPVS: Creating netns size=2200 id=8176
[Wed Sep 23 03:07:35 2020] br0: port 8(veth5359) entered forwarding state
[Wed Sep 23 03:07:36 2020] br0: port 2(veth0) entered forwarding state
[Wed Sep 23 03:07:36 2020] br0: port 20(veth5370) entered forwarding state
[Wed Sep 23 03:07:36 2020] br0: port 3(veth1) entered forwarding state
[Wed Sep 23 03:07:36 2020] docker_gwbridge: port 15(veth8c355a4) entered forwarding state
[Wed Sep 23 03:07:36 2020] docker_gwbridge: port 26(vethd0cb96e) entered forwarding state
[Wed Sep 23 03:07:36 2020] docker_gwbridge: port 12(vethd51d233) entered forwarding state
[Wed Sep 23 03:07:36 2020] docker_gwbridge: port 27(vethea45d5e) entered forwarding state
But they don’t correlate directly with the time stamps where our docker host rebuilt all of the stacks.
So far the only theory we have is that VMWARE is creating issues with our docker host and they are marked to be recreated. We have deployed 12 different apps (node, Java Tomcat) and mongo_db containers and they are all stopped and recreated without a definitive reason.
We have also added memory limits on each stack deployment and have also increased the Ram and CPU on the virtual host.
We will include the grafana to continue to search for clues.
Did you find the solution or the reason for your problem?
It is happening exactly the same to me, on currrent Docker Swarm version. I have 3 nodes, and without any reason (that I know), the containers of the stacks shutdown and restart in the same node, at random hours, generating service downtime.
Yes, I checked the Docker daemon logs, and saw similar messages to @ajozz13, and that was the reason because I asked on this post:
May 08 07:43:09 lnx-01-dev dockerd[1223]: time="2025-05-08T07:43:09.033674335Z" level=error msg="node: cf067ff83c7e is unknown to memberlist"
May 08 07:43:38 lnx-01-dev dockerd[1223]: time="2025-05-08T07:43:38.222975454Z" level=error msg="Bulk sync to node dd987604274a timed out"
May 08 09:23:44 lnx-01-dev dockerd[1223]: time="2025-05-08T09:23:44.538824469Z" level=error msg="error while reading from stream" error="rpc error: code = Canceled desc = context canceled"
May 08 11:23:58 lnx-01-dev dockerd[1223]: time="2025-05-08T11:23:58.595499758Z" level=error msg="error receiving response" error="rpc error: code = Canceled desc = context canceled"
I reviewed the monitoring of the VMs in the Hypervisor too (three VMs on the same hipervisor), and they are not showing nothing in particular for the time the containers shutdown and restart.
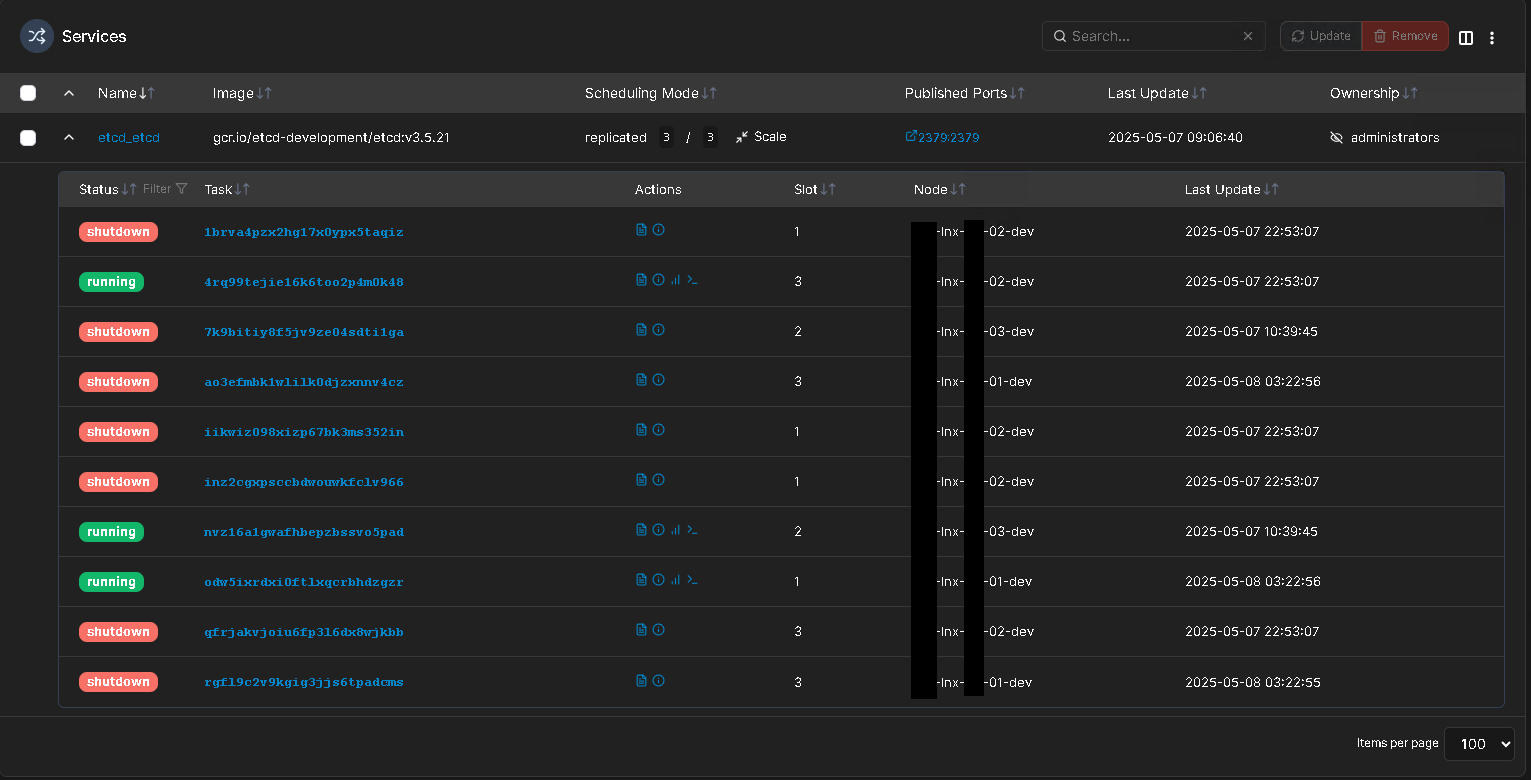
For example, between yesterday and today I had three shutdowns and restarts for etcd stack (this screenshot is from one stack, but on the others stacks happened the same, for the containers that were on the same nodes at that moment):
They were at 05:22 UTC May 8 for node1, 01:53 UTC May 8 for node2, and 13:22 UTC May 7 for node3.
dmesg for node1 at that time: no messages from 11:14 PM to 11:42 AM UTC
dmesg for node2 at that time: no messages from 11:15 PM to 08:53 AM UTC
dmesg for node3 at that time: no messages from 12:50 PM to 01:39 PM UTC
journalctl for docker.service for node1 level=error at that time, nothing, but an hour after: