Hi,
I have multiple elasticsearch containers, each running with 16 GB memory and 8 GB JVM memory.
When i run command to get memory used by container, I see its peaking with 16 GB memory whereas JVM is just even taking 8 GB
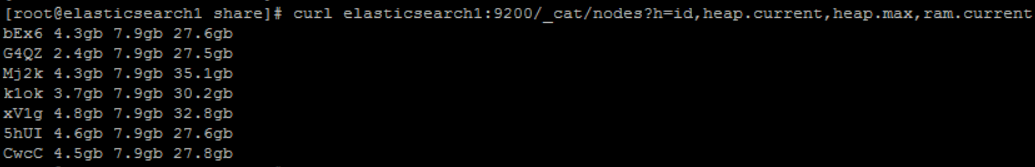
Below is memory consumption of container.

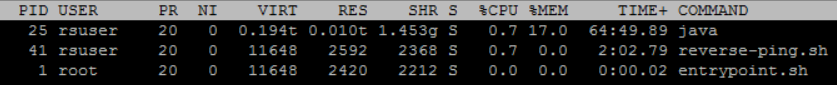
As you can see even when JVM is not even consuming 8 GB, my container is peaking at 16 GB. When I go inside container and run top command, i see this. Its just using 17% memory
Can someone please explain me
- Where is 16GB being utilized?
- Where is 99% memory usage coming from?
- How can i get details of which process using up 99% memory?