I’m new to docker and open-telemetry.
My system-configuration:
- Windows 11
- Docker Desktop on HyperV
My settings:
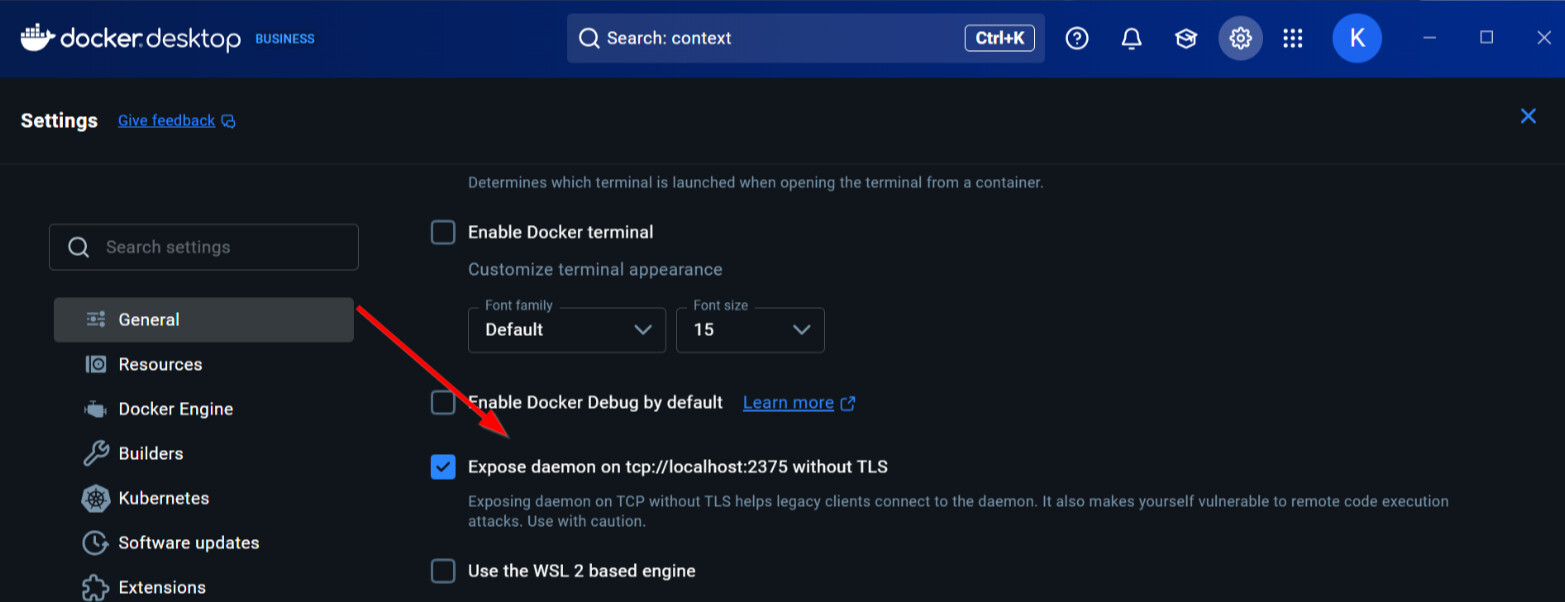
Docker Destkop / Docker Engine
"metrics-addr": "0.0.0.0:9323",   #also test 127.0.0.1
"experimental": true,
otel-config
  docker_stats:
    # endpoint: http://127.17.0.1:9323/metrics                       #not working
    endpoint: http://127.0.0.1:9323/metrics                            #not working
    # endpoint: http://host.docker.internal:9323/metrics       #not working
    # endpoint: http://ip_of_my_physical_host:9323/metrics  #not working
    # endpoint: unix:///var/run/docker.sock  # works on a linux srv
Docker Compose
  otel-collector:
    image: otel/opentelemetry-collector-contrib
   :
    network_mode: host                                  #not working
#    extra_hosts:
#      - "host.docker.internal:host-gateway"  #not working
Now if I go to my browser and goto
-
http://ip_of_my_physical_host:9323/metrics
it shows me the metrics.
But I get error messages from otel-collector :
cannot start pipelines: failed to start "docker_stats" receiver: error during connect:
...
dial tcp: lookup 127.0.0.1:9323/metrics: no such host
Setup a test-env with alpine
   :
    network_mode: host
and I could get metrics within the alpine container, done curl and wget. Means I could reached out to the URLs.
Do you know what is missing/wrong in my (docker) settings?
I try to get metrics of my Desktop Engine with open-telemetry contrib: receiver/dockerstats.